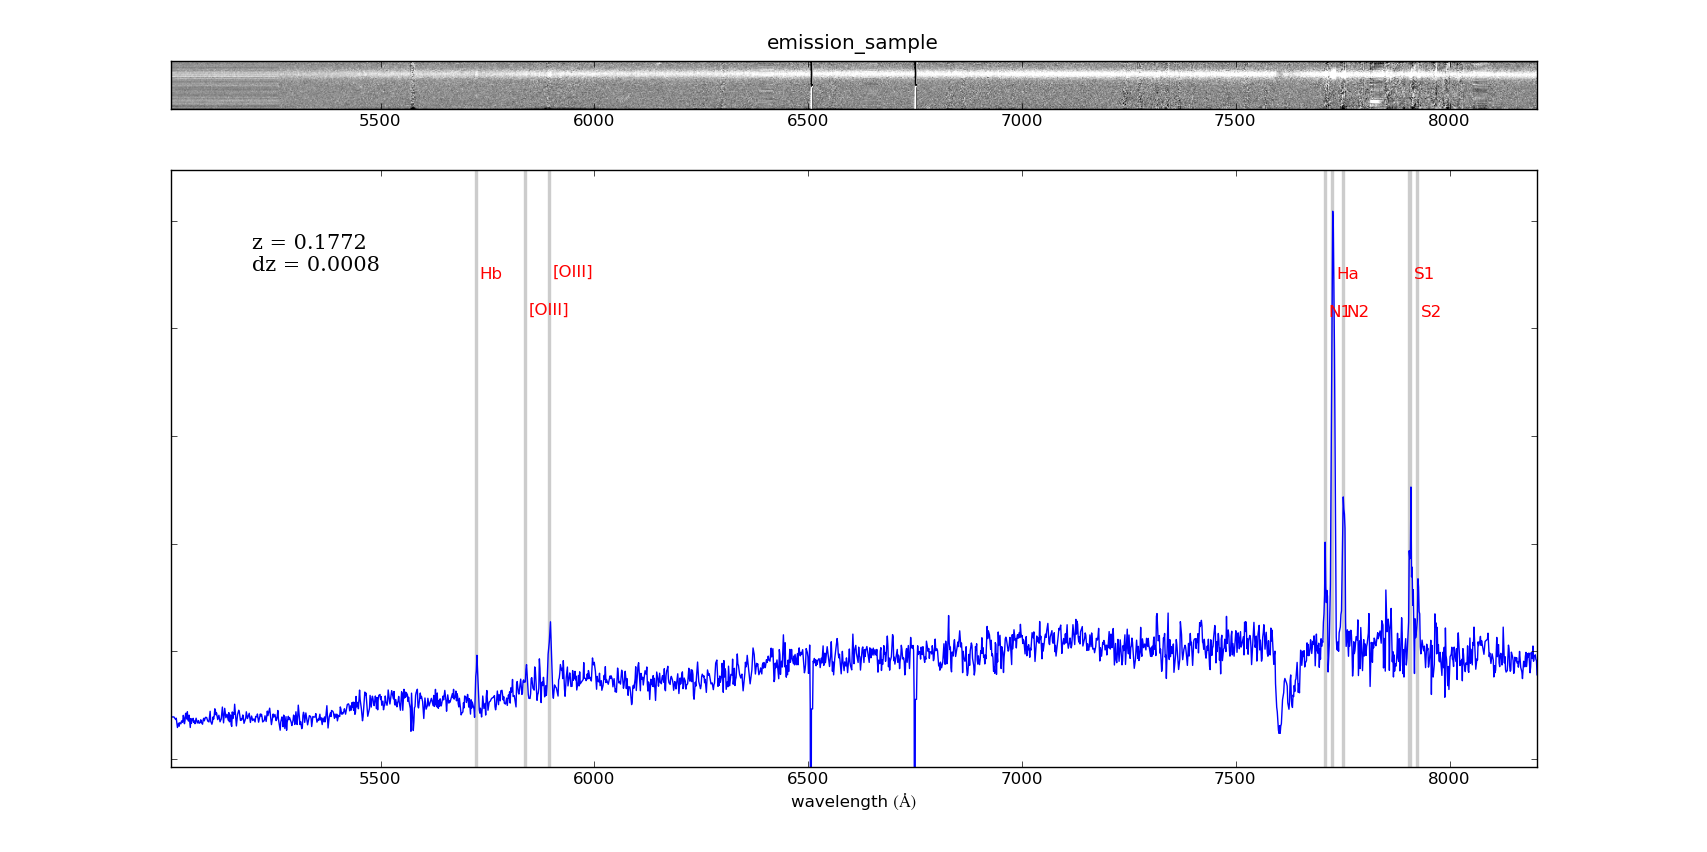
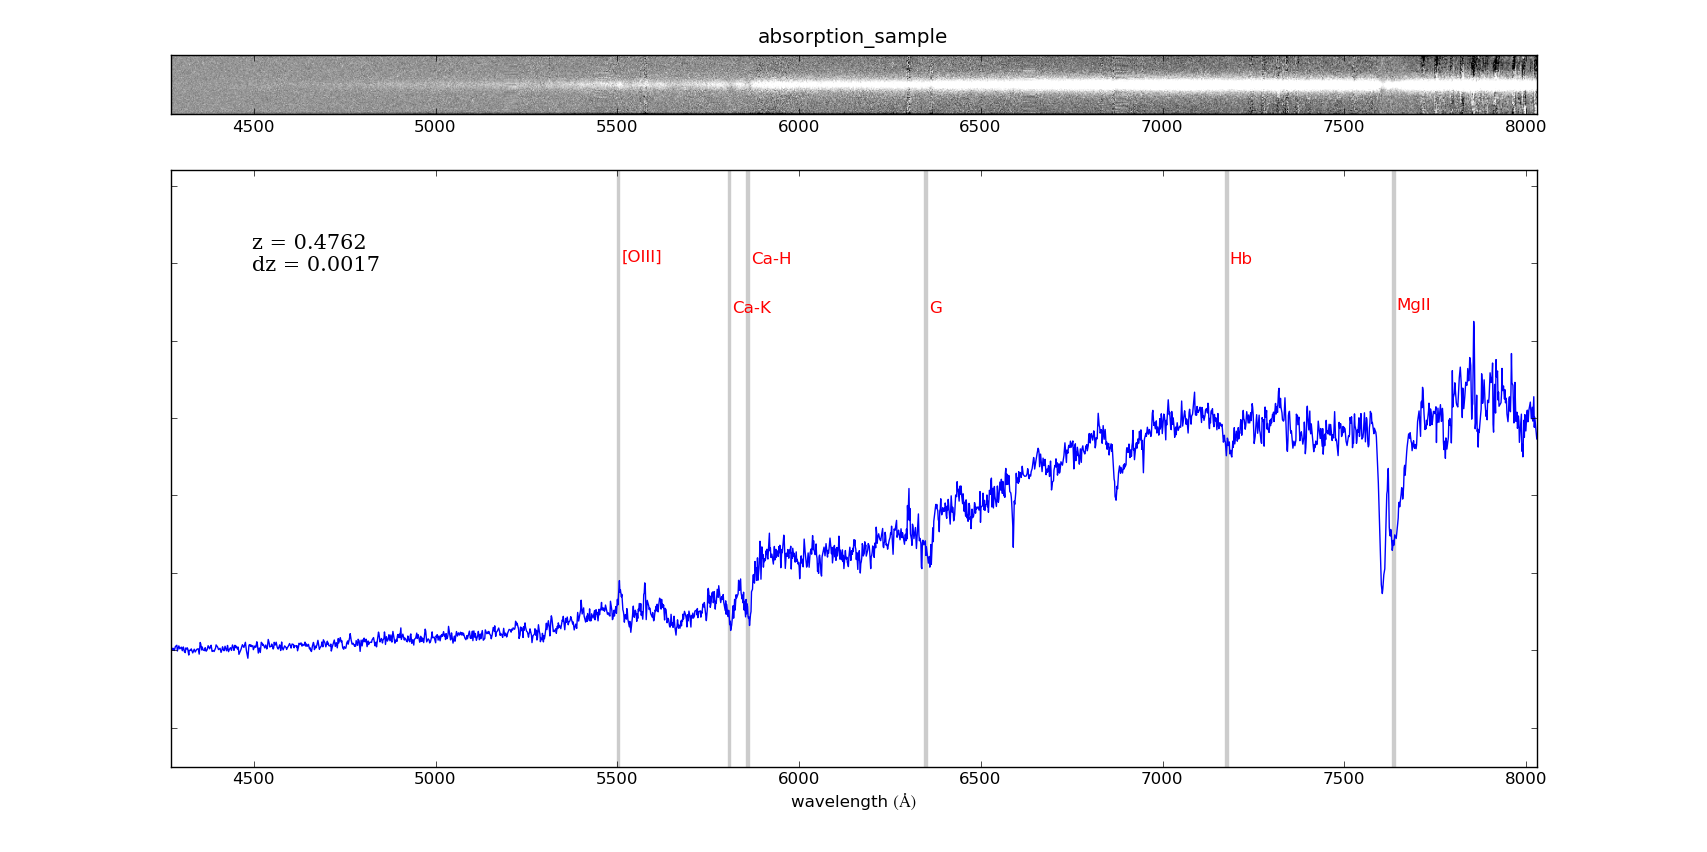
The code takes the following command-line parameters:
Arguments:
file1dtype:stringparameter:Iffilerootis provided, then this is the suffix of the 1d spectrum file, with rootfileroot. Otherwise, this is the full name of the 1d spectrum. The".fits"extension is automatically added to the end of the filename.
file2dtype:stringdefault:''parameter:Iffilerootis provided, then this is the suffix of the 2d spectrum file, with rootfileroot. Otherwise, this is the full name of the 2d spectrum. The".fits"extension is automatically added to the end of the filename. If this is not provided, only the 1d spectrum is displayed.fileroottype:stringdefault:''parameter:A root common to the 1d spectrum filename and the 2d spectrum filename. Iffilerootis provided but notfile1dorfile2d,file1d=fileroot+'e'andfile1d=fileroot+'s'.ztype:floatdefault:0parameter:The redshift to which the lines will be moved, i.e. this should be the redshift you expect the source to be at.cztype:floatdefault:0parameter:The cosmological velocity,c*z, to which the lines will be moved (ifzis provided, this entry is ignored). Note:c = 299792.458 km/s.dvtype:floatdefault:500parameter:The width of the lines to be shown, in km/s.figtitletype:stringdefault:''parameter:A title to print in the plot (e.g. the name of the object). Only takes non-spaced strings for now.linefiletype:stringdefault:''parameter:Text file containing the lines that will be plotted with the spectrum. The format of the file is two columns (space-or tab-separated), the first being the rest-frame wavelength and the second being the name of the line. Lines can be commented with the '#' character. If the file is not provided, a default set of lines including the most common ones (from ~100 to ~700 nm) will be displayed.tickspacetype:intdefault:500parameter:Separation between ticks in the plot, in Angstrom.z1type:floatdefault:Noneparameter:Lower limit, in counts, to plot. If not provided it is automatically calculated as in ds9's zscale.z2type:floatdefault:Noneparameter:Upper limit, in counts, to plot. If not provided it is automatically calculated as in ds9's zscale.contrasttype:floatdefault:0.6parameter:The contrast of the 2d image, as in ds9.threshtype:floatdefault:20parameter:Threshold, in units of sigma, to remove bad pixels from the 1d spectrum. Make it higher if you expect strong emission lines. Only works for very high pixels (as opposed to very negative ones).linefilltype:float between 0 and 1default:0.8parameter:Greyscale color of the shading around each line (with width equal todv), where 0 is black and 1 is white.lheighttype:float between 0 and 1default:0.2parameter:Relative height at which to place the names of the lines, with respect to the maximum value of the spectrum.

