

09BC26 - 10.6h/18.1h - 58.5% complete
09BF22 - 2.1h/17.9h - 11.7% complete
The total completion of the program in 2009B is 35.3%.
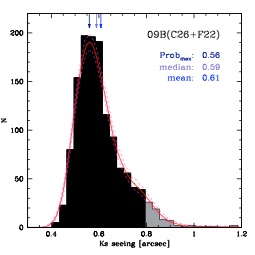
The seeing statistics is shown on the right for all frames observed in 2009B out of which 4.8% are above our nominal target seeing of 0.8” in Ks. The mode (i.e. most likely) seeing is 0.56” in Ks. The red curve shows a non-parametric probability density estimate with 90% confidence limits.
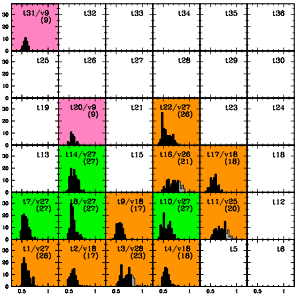
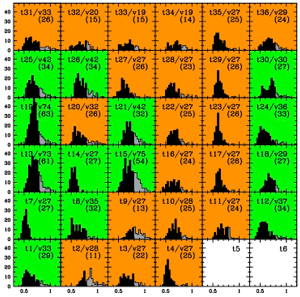
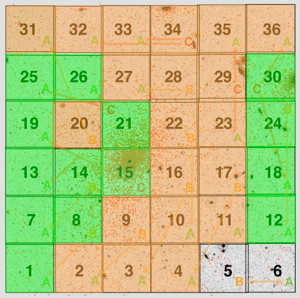
The bottom left panel shows the seeing quality distribution of mosaic tiles that were observed in 2009B. The color coding corresponds to the number of visits with Ks seeing <= 0.8 arcseconds per tile, which is also indicated by ‘(#)’ in each tile legend. Pink - less than 10 visits, orange - 10 or more visits per tile, but tile sequence is not completed, green - tile sequence completed.

2009B
Data acquisition for NGVS-IR started in 2009B and continues in 2010A. You can follow the current WIRCam activities here.
All WIRCam observations have been completed in 2009B and 2010A.
Left: CFHT hard at work.
10AC10 - 24.7h/33.6h - 73.4% complete
10AF03 - 17.0h/23.0h - 73.7% complete
The total completion of the program until 2010A is 89%.
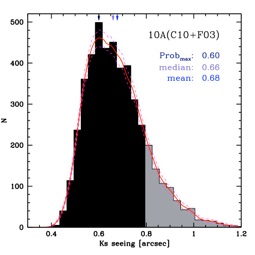
The seeing statistics is shown on the right for all frames observed in 2010A out of which 20% are above our nominal target seeing of 0.8” in Ks. The mode (i.e. most likely) seeing is 0.6” in Ks. The red curve shows a non-parametric probability density estimate with 90% confidence limits.
The bottom left panel shows the seeing quality distribution of mosaic tiles that were observed in 2010A. The color coding corresponds to the number of visits with Ks seeing <= 0.8 arcseconds per tile, which is also indicated by ‘(#)’ in each tile legend. Pink - less than 10 visits, orange - 10 or more visits per tile, but tile sequence is not completed, green - tile sequence completed.
2010A
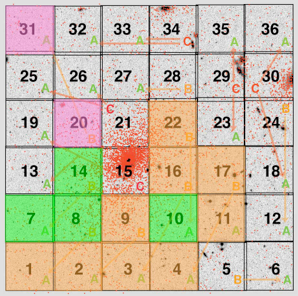
Right: Completeness chart for the WIRCam mosaic using available observations from 2009B and 2010A. Rollover with your mouse to see the seeing distributions for each tile.
Color coding:
pink - less than 10 visits per tile
orange - 10 or more visits per tile, but tile sequence not completed
green - tile sequence completed
The histogram in each tile shows the seeing distribution function of individual exposures; frames with seeing > 0.8” are in grey, their numbers is given in parentheses. The number preceded by ‘v’ indicates the number of visits (i.e. 4x25 sec sequence dither).
Observations
Observations by semester