AGN are very luminous and compact objects presenting strong emission lines
on top of a nearly flat SED(see Figure 1.1). Dramatic
luminosity variations are often observed in X-rays indicating very high
brightness temperatures confined into very small regions. In order to explain
these facts a standard model built around a SMB accreting matter as a
central source, has been put togheter in the last decades (see Rees et al. [1982],
Antonucci [1993] for a review and the books by Robson [1996] and
Peterson [1997]). This model succesfully accounts for the energy budget required
by the observed luminosities. For instance, a ![]()
![]() black hole spherically
accreting at a steady rate of 1
black hole spherically
accreting at a steady rate of 1![]() yr
yr![]() can easily produce
can easily produce ![]()
![]() if radiating at the Eddington limit. The accretion occurs on an equatorial disk
around the black hole. If the inner radius of this disk is comparable to the
Schwarzschild radius then thermal radiation from this region will peak at a
wavelength of
if radiating at the Eddington limit. The accretion occurs on an equatorial disk
around the black hole. If the inner radius of this disk is comparable to the
Schwarzschild radius then thermal radiation from this region will peak at a
wavelength of ![]() 100Å explaining the X-ray emission and the observed time
scale of the luminosity variations. The lack of features in the SED can be
explained by the superposition of Planck spectra associated to consecutively
decreasing temperatures from the inner to the outer edge of the disk. The model
also includes a region of surounding obscuring material or TORUS.
Associated clouds responsable for the line emission are located in two well
defined regions: The BLR is directly heated by the central source producing
line emission with typical FWHM of
100Å explaining the X-ray emission and the observed time
scale of the luminosity variations. The lack of features in the SED can be
explained by the superposition of Planck spectra associated to consecutively
decreasing temperatures from the inner to the outer edge of the disk. The model
also includes a region of surounding obscuring material or TORUS.
Associated clouds responsable for the line emission are located in two well
defined regions: The BLR is directly heated by the central source producing
line emission with typical FWHM of ![]() 5000km
5000km![]() . Beyond the BLR, the
less dense and cooler NLR emits narrower lines with typical linedwidths of
FWHM
. Beyond the BLR, the
less dense and cooler NLR emits narrower lines with typical linedwidths of
FWHM ![]() 500km
500km![]() . The model may also be able to explain the relativistc
outflow which will form the jets observed in some sources.
. The model may also be able to explain the relativistc
outflow which will form the jets observed in some sources.
![\includegraphics[width=0.9\hsize]{FIGURES/SED_n5548.ps}](img20.png)
|
Direct imaging of the central source is impossible with the available resolution
however, the effects it produces on its suroundings can still be observed. One
of the best pieces of evidence supporting the existence of SMBs are the
observations of water maser dynamics in the nucleus of NGC4258 (see Figure
1.2). These observations imply an enclosed mass of
3.6![]()
![]()
![]() within a region of less than 9
within a region of less than 9![]()
![]() pc
pc![]() [Greenhill et al., 1995] indicating the existence of a very massive and compact
object.
[Greenhill et al., 1995] indicating the existence of a very massive and compact
object.
![\includegraphics[width=0.45\hsize]{FIGURES/ngc4258_rotation.ps}](img25.png)
![\includegraphics[width=0.45\hsize]{FIGURES/ngc4258.ps}](img26.png) |
Starburst galaxies emit the bulk of their radiation in the FIR part of the
spectrum and are among the most luminous objects in the local universe. These
galaxies exhibit strong emission lines resembling those observed towards HII regions and do not show evidence of an AGN as their primary energy source
(see section 1.1). In contrast, the emission lines arise from massive
star formation occuring in their nuclei [Terlevich et al., 1987] over a region of
![]() 1kpc in size. The starburst activity is assumed to be triggered by
dinamical interaction with another galaxy. The resulting tidal forces will push
the gas clouds togheter inducing their gravitational collapse and the consequent
formation of stars. Once the starburst has been initiated, the more massive
stars will evolve quickly and explode as supernovas compressing the surounding
gas inducing more star formation until most of the available gas has been
transformed into stars or blown away by the explosions. This mechanism explains
the observed FIR emission as dust reradiation of starlight. It also
explains the radio emission as a combination of free-free emission, arising from
the HII regions around young stars, and synchrotron emission from relativistic
electrons generated in supernova events. Furthermore, it offers an explanation
for the well known FIR-radio correlation (see Section 1.3)
and for the observed conical outflows or superwinds [Heckman, 2003].
1kpc in size. The starburst activity is assumed to be triggered by
dinamical interaction with another galaxy. The resulting tidal forces will push
the gas clouds togheter inducing their gravitational collapse and the consequent
formation of stars. Once the starburst has been initiated, the more massive
stars will evolve quickly and explode as supernovas compressing the surounding
gas inducing more star formation until most of the available gas has been
transformed into stars or blown away by the explosions. This mechanism explains
the observed FIR emission as dust reradiation of starlight. It also
explains the radio emission as a combination of free-free emission, arising from
the HII regions around young stars, and synchrotron emission from relativistic
electrons generated in supernova events. Furthermore, it offers an explanation
for the well known FIR-radio correlation (see Section 1.3)
and for the observed conical outflows or superwinds [Heckman, 2003].
![\includegraphics[width=0.9\hsize]{FIGURES/SED_arp220.ps}](img27.png)
|
Lying between Starburst galaxies and the weaker AGNs are the LINER galaxies. These galaxies present a scaled down version of the emission lines observed in AGN. Being a common phenomenon, it is important to discover whether is due to the presence of a mini-AGN or some other mechanism. LINERs are perhaps transition objects between two different types of activity. It now seems certain that most of the galaxies contain black holes in their centres, consequently the existence of a link between AGN and starburst activity seems plausible [Scoville, 2003].
A correlation between the ![]() 10
10 ![]() m and
m and ![]() 21 cm luminosities
associated with Seyfert nuclei was discovered in the seventies (Rieke & Low [1972],
van der Kruit [1973]). At first both, the infrared and radio emissions, were thought
to be of synchrotron origin. Later, it was proposed that the infrared was
actually thermal reradiation from dusty HII regions, while the radio was
dominated by synchrotron emission from SNR originated by the same
population of stars ionizing the HII regions [Harwit & Pacini, 1975]. The infrared to
radio flux ratio was found to be correlated with the classification of luminous
nuclei as starbursts or AGN according to their radio morphologies
[Condon et al., 1982]. The advent of the large IRAS survey in addition to optical
classification using the observed line ratios [Veilleux & Osterbrock, 1987] contributed to
confirm and quantify the proportionality between infrared and radio emission.
The cause of this effect can be illustrated using a simplified model. Let
21 cm luminosities
associated with Seyfert nuclei was discovered in the seventies (Rieke & Low [1972],
van der Kruit [1973]). At first both, the infrared and radio emissions, were thought
to be of synchrotron origin. Later, it was proposed that the infrared was
actually thermal reradiation from dusty HII regions, while the radio was
dominated by synchrotron emission from SNR originated by the same
population of stars ionizing the HII regions [Harwit & Pacini, 1975]. The infrared to
radio flux ratio was found to be correlated with the classification of luminous
nuclei as starbursts or AGN according to their radio morphologies
[Condon et al., 1982]. The advent of the large IRAS survey in addition to optical
classification using the observed line ratios [Veilleux & Osterbrock, 1987] contributed to
confirm and quantify the proportionality between infrared and radio emission.
The cause of this effect can be illustrated using a simplified model. Let
![]() ,
,
![]() and
and
![]() be the total radio thermal, radio
NT and infrared luminosities respectively. In addition, let
be the total radio thermal, radio
NT and infrared luminosities respectively. In addition, let
![]() be the
SFR of stars having masses
be the
SFR of stars having masses ![]()
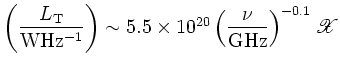
![]() . The thermal (free-free) radio
luminosity estimated from stellar models is:
. The thermal (free-free) radio
luminosity estimated from stellar models is:
 |
(1.1) |
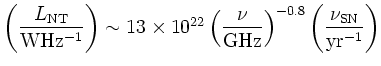
The NT synchrotron component produced by relativistic electrons originated
by a sustained super nova rate
![]() is given by the empirical relation
[Condon & Yin, 1990]:
is given by the empirical relation
[Condon & Yin, 1990]:
 |
(1.2) |
If the IMF
![]() is time independent and assuming that
all stars more massive than
is time independent and assuming that
all stars more massive than
![]()
![]() will become supernovas, then
the radio SNR and
will become supernovas, then
the radio SNR and
![]() are linearly proportional. Hence,
are linearly proportional. Hence,
![]() and
consequently
and
consequently
![]() are linearly proportional to
are linearly proportional to
![]() .
.
![\includegraphics[width=0.8\hsize]{FIGURES/radio_fir_condon91a.ps}](img39.png)
|
Regions of massive star fomration are generally highly obscured by dust. Thus,
about 2/3 of the luminosity produced by stars emerge in the FIR band between 40
and 120 ![]() m [Helou et al., 1988]. if
m [Helou et al., 1988]. if ![]() is the lifetime of a star with mass
is the lifetime of a star with mass
![]() and
and ![]() its averge bolometric luminosity, then the total FIR luminosity
its averge bolometric luminosity, then the total FIR luminosity
![]() can be expressed as:
can be expressed as:
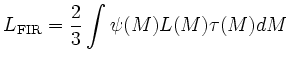 |
(1.3) |
 |
(1.4) |
Both
![]() and
and
![]() are linearly proprtional to
are linearly proprtional to
![]() ,
therefore this model implies a linear FIR/radio correlation with a logarithmic
slope of
,
therefore this model implies a linear FIR/radio correlation with a logarithmic
slope of
![]() . Figure 1.4 shows a plot of
the observed 1.49 GHz flux densitiy [Condon et al., 1987] for galaxies in the revised
IRAS BGS [Soifer et al., 1989] versus the total far infrared luminosity derived via
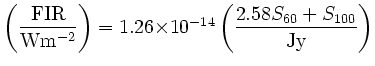
[Helou et al., 1988]:
. Figure 1.4 shows a plot of
the observed 1.49 GHz flux densitiy [Condon et al., 1987] for galaxies in the revised
IRAS BGS [Soifer et al., 1989] versus the total far infrared luminosity derived via
[Helou et al., 1988]:
Starburst galaxies tightly follow the FIR-Radio correlation for at least three orders of magnitude in FIR luminosities from dust rich dwarfs to ULIRGs. The assumption that the correlation holds at all scales allows the use of radio interferometry observations to probe the FIR emission at high resolutions . Finally, the correlation is known to apply at cosmological distances [Appleton et al., 2004] opening the possibility to study the SFR as a function of redshift which is a fundamental issue in understanding galaxy formation and evolution [Madau et al., 1996].
Galaxies are classified as AGN or Starbursts using the relative strength of their emission lines as indicators of the underlaying excitation mechanism [Baldwin et al., 1981]. If the excitation is due to photoionization by O and B stars then the galaxy is likely to have an HII or Starburst nucleus. In contrast, the presence of lines excited by a power-law continuum source is the clear signature of Seyferts.
The choice of the intensity ratios on which base the clasification is restricted
by several issues. Veilleux & Osterbrock [1987] put forward a semi empirical method based on the
reddening-insensitive line ratios [OIII]
![]() /H
/H![]() , [NII]
, [NII]
![]() /H
/H![]() and [OI]
and [OI]
![]() /H
/H![]() . Using numerical
models of starbursts, Kewley et al. [2001] developed a theoretical classification scheme
based on the same ratios. An empirical revision to this method supported by a
massive sample of galaxies from the SDSS is proposed by Kauffmann et al. [2003]: a
galaxy is classified as AGN if
. Using numerical
models of starbursts, Kewley et al. [2001] developed a theoretical classification scheme
based on the same ratios. An empirical revision to this method supported by a
massive sample of galaxies from the SDSS is proposed by Kauffmann et al. [2003]: a
galaxy is classified as AGN if
![$\displaystyle \log\left(\frac{\rm [\hbox{O\small {III}}]}{\rm\hbox{H\small {$\b...
...\hbox{N\small {II}}]}{\rm\hbox{H\small {$\alpha$}}}\right)-0.05\right]^{-1}+1.3$](img55.png) |
(1.6) |
![\includegraphics[width=0.8\hsize]{FIGURES/BPT_diagram.ps}](img59.png) |
OH megamasers are associated with LIRG showing evidence of starburst
activity and a high S![]() /S
/S![]() ratio. The analysis of the strength
of the different maser transitions in addition to the observation of OH
absorption in the infrared suggest that these masers are radiatively pumped by
infrared photons. This may explain the
ratio. The analysis of the strength
of the different maser transitions in addition to the observation of OH
absorption in the infrared suggest that these masers are radiatively pumped by
infrared photons. This may explain the
![]() [Martin et al., 1988] proportionality between the OH and FIR luminosities (see
Figure 1.6). High resolution observations show a spatial coincidence
of the maser emission and radio continuum at
[Martin et al., 1988] proportionality between the OH and FIR luminosities (see
Figure 1.6). High resolution observations show a spatial coincidence
of the maser emission and radio continuum at ![]() 100pc scales indicating that
both are originated within the same region of star formation activity. Hence,
the study of maser emission allows to probe the physics of the dense
concentrations of gas in the highly obscured nuclear environments of starbursts
.
100pc scales indicating that
both are originated within the same region of star formation activity. Hence,
the study of maser emission allows to probe the physics of the dense
concentrations of gas in the highly obscured nuclear environments of starbursts
.
![\includegraphics[width=0.8\hsize]{FIGURES/FIR_OH.ps}](img63.png) |